Bitcoin and investing Publication · 2026
What shakes Bitcoin's price
Original title: Bitcoin Event Windows and Ecosystem Indicators, 2012–2024: Market, Trust, Protocol, and Institutional Milestones
Bitcoin's story is usually told through price charts. With my colleagues from the department we went through 21 events from 2012 to 2024 instead — halvings, protocol upgrades, exchange collapses and regulatory milestones — and measured what each did to the price and to the machinery behind it. Losses of trust hurt the most.
Why it is worth reading: Instead of another price story it offers a sorting device — which layer of Bitcoin actually shook at which event: the market, trust, the protocol or the institutions.
What to take away
- Not every big headline is the same: we sorted events by mechanism into monetary (halvings), technological, trust shocks and institutional or regulatory ones. Throwing them into one bag of “crypto news” is misleading.
- The worst short-window drops followed losses of trust — Mt. Gox, Terra/UST and FTX. Dating is decisive: the market reacts to the first public information (withdrawals halted, a liquidity crisis admitted), not to the later legal filing.
- When an exchange collapsed, the protocol kept going. The network's computing power and active addresses did not crash; coin flows to exchanges and trading volumes surged. The intermediaries failed, not Bitcoin itself.
- Halvings, which we examined in an earlier article, barely move the price in a window of a few days — the market has known their dates for years. Their story plays out over longer horizons.
Explained in plain language
Why the price chart is not enough
Bitcoin is usually narrated in the language of price charts: when it soared, when it crashed. But Bitcoin is not just a price. It is a layered system — the protocol with its rules and miners at the bottom, a service layer of exchanges, wallets and custodians above it, and institutions and regulators on top. Different events shake different layers, and when everything is lumped together as “crypto news”, that difference disappears.
What we did
With my colleagues from the department we assembled a chronology of 21 dated events from 2012 to 2024 — from the first halving through the Mt. Gox collapse, China’s mining crackdown and El Salvador’s experiment to the approval of U.S. spot ETFs and the reaction to the 2024 election. We classified each event by mechanism (monetary, technological, trust shock, institutional or regulatory) and, on daily data, measured how the price in the days around it deviated from its usual behaviour.
The key detail is dating: we date an event to the first public information, not to the official paperwork. So Mt. Gox is not dated to the bankruptcy at the end of February 2014 but to the halt of withdrawals on 7 February; FTX not to the court filing but to 8 November 2022, when the liquidity crisis came to light. And we removed three purely price-defined milestones — such as the first break above USD 1,000 — from the comparisons: they belong to the history books, but as evidence they would be cheating, since they are selected precisely because the price moved.
The 21 events on one timeline
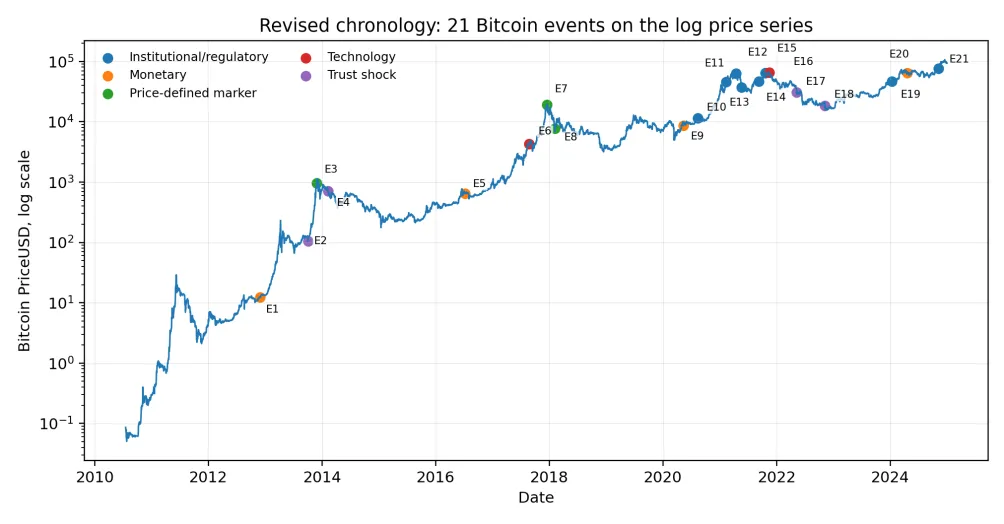
The event chronology on the logarithmic Bitcoin price scale (Figure 1 from the article; CC BY 4.0 licence).
| Date | Event | Category |
|---|---|---|
| 28 November 2012 | First halving | monetary |
| 2 October 2013 | Silk Road seizure | trust shock |
| 27 November 2013 | First break above USD 1,000 | price-defined marker |
| 7 February 2014 | Mt. Gox halts withdrawals | trust shock |
| 9 July 2016 | Second halving | monetary |
| 24 August 2017 | SegWit activation | technology |
| 17 December 2017 | 2017 market peak | price-defined marker |
| 6 February 2018 | Fall below USD 6,000 | price-defined marker |
| 11 May 2020 | Third halving | monetary |
| 11 August 2020 | MicroStrategy purchase announcement | institutional/regulatory |
| 8 February 2021 | Tesla purchase disclosure | institutional/regulatory |
| 14 April 2021 | Coinbase direct listing | institutional/regulatory |
| 21 May 2021 | China mining/trading crackdown | institutional/regulatory |
| 7 September 2021 | El Salvador legal-tender launch | institutional/regulatory |
| 19 October 2021 | First U.S. Bitcoin futures ETF | institutional/regulatory |
| 14 November 2021 | Taproot activation | technology |
| 9 May 2022 | Terra/UST crisis | trust shock |
| 8 November 2022 | FTX liquidity crisis | trust shock |
| 10 January 2024 | U.S. spot Bitcoin ETP approvals | institutional/regulatory |
| 20 April 2024 | Fourth halving | monetary |
| 6 November 2024 | U.S. election reaction | institutional/regulatory |
The three price-defined milestones serve only as historical markers — they do not enter the mechanism comparisons.
What came out of it
Losses of trust fared worst. In the week-long windows around the falls of Mt. Gox, Terra/UST and FTX, the median price was 17 to 22 log-return percentage points below its usual behaviour — roughly a fifth. Halvings, by contrast, barely moved the price in the short window; the market has known their dates for years. And institutional events are a mixed bag — not even the spot ETF approval guaranteed a green number on announcement day.
The exchange fell, not Bitcoin
What happened beyond the price during trust shocks is telling. Coin flows to exchanges rose by more than half in the median and trading volumes by almost three quarters — people were moving and selling. But the network’s computing power and the number of active addresses did not collapse. Blocks kept coming. It was the intermediaries people had entrusted their coins to that failed, not the protocol that manages the coins.
How to read this
Now honestly about the limits. Twenty-one hand-picked events are not the whole history of Bitcoin. After a statistical correction for the number of tests, no single event stands on its own, and once we controlled for the movement of the rest of the crypto market and equities, some effects shrank. That is why we read the results as a description of selected episodes, not as a law. Even so, we believe a frame that separates the market, trust, the protocol and the institutions is more useful than the one-size-fits-all label of “Bitcoin news”.
This text is a popularised summary of a research paper and serves educational purposes. It is not investment advice.
Show abstract
Official abstract in its original wording.
Bitcoin is often narrated through price cycles, yet major dated events affect different layers of the ecosystem. This study analyzes 21 Bitcoin-related events between 2012 and 2024 using a first-public-information dating rule, a mechanism-based event taxonomy, and daily Coin Metrics data. Price-defined milestones are retained as historical markers but excluded from mechanism-level comparisons. Baseline cumulative abnormal log returns are estimated with a constant-mean model over days −120 to −21 and reported for [−1,+1], [−3,+3], and [−7,+7] windows. The analysis adds standardized CARs, Benjamini–Hochberg multiplicity checks, date-sensitivity tests, estimation-window sensitivity, a market model using a capitalization-weighted Bitcoin-excluded crypto proxy, a crypto-plus-macro model using S&P 500 and broad U.S. dollar-index returns, and non-price ecosystem indicators. In the clean mechanism sample, trust shocks have the most negative median raw CARs (−16.8, −22.3, and −21.6 log-return percentage points across the three windows); exact trust-versus-other tests are significant for CAR3 and CAR7 (p = 0.002) but not for CAR15 (p = 0.082). Standardized tests show the same short-window pattern (p = 0.009 and p = 0.006). No individual event-level empirical p-value survives a 5% Benjamini–Hochberg correction, and market-model controls attenuate several effects, so the findings are interpreted descriptively rather than causally. On-chain indicators show that trust shocks coincide with elevated exchange flows and spot volume, while active-address and hash-rate measures do not indicate protocol-layer collapse. The study contributes a transparent framework that separates market reaction, service-layer stress, protocol resilience, and institutional significance.